


Expect two snow days this winter

Winter is a forecaster’s dream whether you dread or embrace the snow. The long, complex analysis required to understand the dynamics of winter climate is part of the fulfillment that comes with being a meteorologist.That is why I have put hours of research into this outlook in order for it to be the most professional and in-depth analysis I have ever written!
Summary of my winter forecast
The above graphic showcases my conclusions about snowfall and temperature output this coming winter. Overall, I think we will start off relatively warm and stormy (note that I didn’t say snowy), but transition to a much colder and snowier pattern. And given that some of the storms, especially towards the end of the winter season, could be relatively large, I expect TWO snow days for University of Pennsylvania students!
You have probably heard meteorologists talk about the many factors that are involved with making such a tough long-range forecast. The atmosphere is so intricate that if I were to discuss every single driver, it would turn into a research paper rather than an overview. Instead, I’ll go over what I think are the most important pieces to the puzzle.
Six factors affecting the winter forecast
1. ENSO (El Niño Southern Oscillation)
By now, many of you have heard of the phenomenon known as El Niño. Currently, it is sitting in an extremely strong state, meaning that a large chunk of water in the Pacific Ocean is extremely warm. The big story for many meteorologists this upcoming winter will be whether or not it stays in its strong state or weakens over the next few months. Many have speculated that since we have a strong El Niño this year that it unanimously leads to a warm winter as it has in some years past, when in fact they’re wrong. Although El Niño builds warmer air into the continental U.S., there are factors that way against it that can force colder air to win out. This comes down to the placement of the greatest warming of El Niño in the Pacific. El Niño is much more complex than just temperatures in the ocean. It can be broken down into different sections based on longitude and latitude and every section tells us something different about our atmosphere.

Above left: Courtesy of the National Oceanic and Atmospheric Administration
If you take a look at the above graphic, you can see where Regions 1+2 are located. Regions 1+2 have been cooling more rapidly than any other region farther west of it while Region 4 has been warming dramatically recently. In short, this reinforces the idea of a “west” El Niño, which would be more favorable for a snowy pattern in the Eastern US.
Conclusion: Above Average precipitation and lots of stormy activity
2. Anomalies/Similar Years
The two winter seasons that stand out when comparing them with this year are 1997-98 and 1982-83. The 1997-98 El Niño, in most recent memory, has a seemingly obvious correlation to this season. Warm air flooded the country that season so all the storms we saw were rain. Philadelphia recorded less than 1 inch of snow that entire winter! Could that happen again? Yes, but the chances of that are slim to none. Why? There is one huge difference in the Sea Surface Temperature Anomalies (temperature of the ocean compared to normal). If you look at the images below, you can see that the Gulf of Alaska, down the West Coast, and the Atlantic are all much warmer now than they were in 1997-98. This is called a negative PDO, which I’ll explain later. Depending on where the warm or cold temperatures set up, they play a crucial role in determining where and how the jet stream sets up during the winter. As you can see, there are fundamental differences between this El Niño and the one in 1997-98.

Above: Sea Surface Temperatures on Nov. 3, 1997 | Courtesy of the National Oceanic and Atmospheric Administration

Above: Sea Surface Temperatures on Nov. 16, 2015 | Courtesy of the National Oceanic and Atmospheric Administration
The other strong El Niño in recent history was 1982-83. Looking at just snow totals, we find that Philadelphia had 35.9 inches that winter. But, it turns out that most of that snow fell in ONE storm — The Blizzard of 1983, when Philadelphia recorded 21.3 inches. In fact, more than one inch of snow only fell on four days that winter! So, it’s fair to say that that season was an anomaly.
Conclusion: Stormy with chances for snow mainly after Christmas
3. The Atlantic Ocean, the NAO, and the AO
The temperature of the Atlantic Ocean, the NAO and AO are all related. The NAO is one of the most critical winter indexes because it can deliver a very active weather pattern and aid in the permanency of cold weather. When the NAO is negative, high pressure near Greenland creates a “blocking” pattern that allows bigger storms to develop along the East Coast. A positive phase means the vice versa usually occurs, but it does not necessarily mean that we will see less snowfall. For the past two winters, the NAO was mainly positive, but other factors helped maintain the cold over our area. The Arctic Oscillation (AO) is a climate index of the state of the atmospheric circulation over the Arctic. In the negative phase, the polar low-pressure system (also known as the polar vortex) over the Arctic is weaker, which results cold, Arctic air pushing farther south into the U.S. The opposite is true when the AO is positive: the polar circulation is stronger, which forces cold air and storms to remain farther north. During the winter of 2009-10 where Philadelphia saw 78” of snow, the AO and NAO were negative for a majority of the season.
Now, how do these two indexes relate to the Atlantic Ocean? Well, Atlantic Sea Surface Temperature anomalies currently show 2 areas of warmth in the Davis Strait and western Atlantic. They also show a cooler pool of water in the Northern Atlantic. This type of setup has been known to develop a negative NAO. The most recent winters that saw a notable negative NAO with a similar Atlantic Ocean anomaly map were in 2009-10 and 2010-11. Both those winter seasons produced historically large coastal storms. Take a look at what the waters in the Atlantic look like right now.

Above: Atlantic Ocean Sea Surface Temperatures as of Nov. 16, 2015 | Courtesy of the National Oceanic and Atmospheric Administration
And now take a look at them back in 2009. See the resemblance? Now, I’m not saying that this winter will be like 2009-10 because the patterns are very different. This is just one of many references to compare patterns. There is a good correlation between the two, which point towards a negative NAO.

Above: Atlantic Ocean Sea Surface Temperatures as of Nov. 16, 2009 | Courtesy of the National Oceanic and Atmospheric Administration
Conclusion: More blocking and colder air favors colder and snowier conditions
4. Siberian snow coverage
This year, we’ve seen a consistent buildup of snow cover in Eurasia. Snow cover is a very important variable for the winter forecast and is centered directly around the Arctic Oscillation. There has been much research done on the correlation between snow cover and snowfall here, which has found that there is a high relationship between the two. When the AO is in a negative phase, we get more heat shifted to the poles with areas of ridging forcing the Polar Vortex to split or move out from the Arctic Circle towards us. This results in the wavy pattern with many troughs and ridges — the classic signature of an active winter pattern. During the positive phase, the opposite happens with the Polar Vortex, keeping the cold air bottled up in the higher latitudes. Right now, there has been above average snow coverage over Siberia and it will only continue to grow. The more snow cover we see, the more likely a negative AO will develop, which means snow is more likely.

Above: Current Snowfall as of Nov. 17, 2015 | Courtesy of Rutgers Global Snow Lab
Conclusion: More snow cover points to more snow in our region
5. PDO (Pacific Decadal Oscillation) & The Pacific Ocean
The Pacific Decadal Oscillation (PDO) Index is defined as the leading component of the North Pacific sea surface temperature averages. The broad area of above average water temperatures off the coast of North America from Alaska to the equator is a classic feature of the warm phase of the PDO (as can be seen in the images in Part 2). The warm waters wrap in a horseshoe shape around a core of cooler-than-average water. Impacts from the PDO depend in part on how it is aligned with the ENSO cycle; if the cycles are in opposite phases, then effects will be weakened. However, when both the PDO and ENSO are in the warm phase, meaning ENSO would be in the El Niño phase, expected impacts on the region include below average winter temperatures and above average winter snowfall. We know that the ENSO is in a very warm state and it looks as though a warm PDO has taken shape judging by sea surface temperatures. This could also lead to the return of a negative EPO (which I’ll explain in the next section) and a positive PNA, which represents ridging over the West Coast. This allows warmer air to flow into the Western US and colder air into the Eastern US. Signs are pointing towards a warm PDO taking shape during this winter season.

Above: A warm PDO cycle | Courtesy of Giorgiogp2/Creative Commons
Conclusion: Leads to stormier weather and ushers in colder air
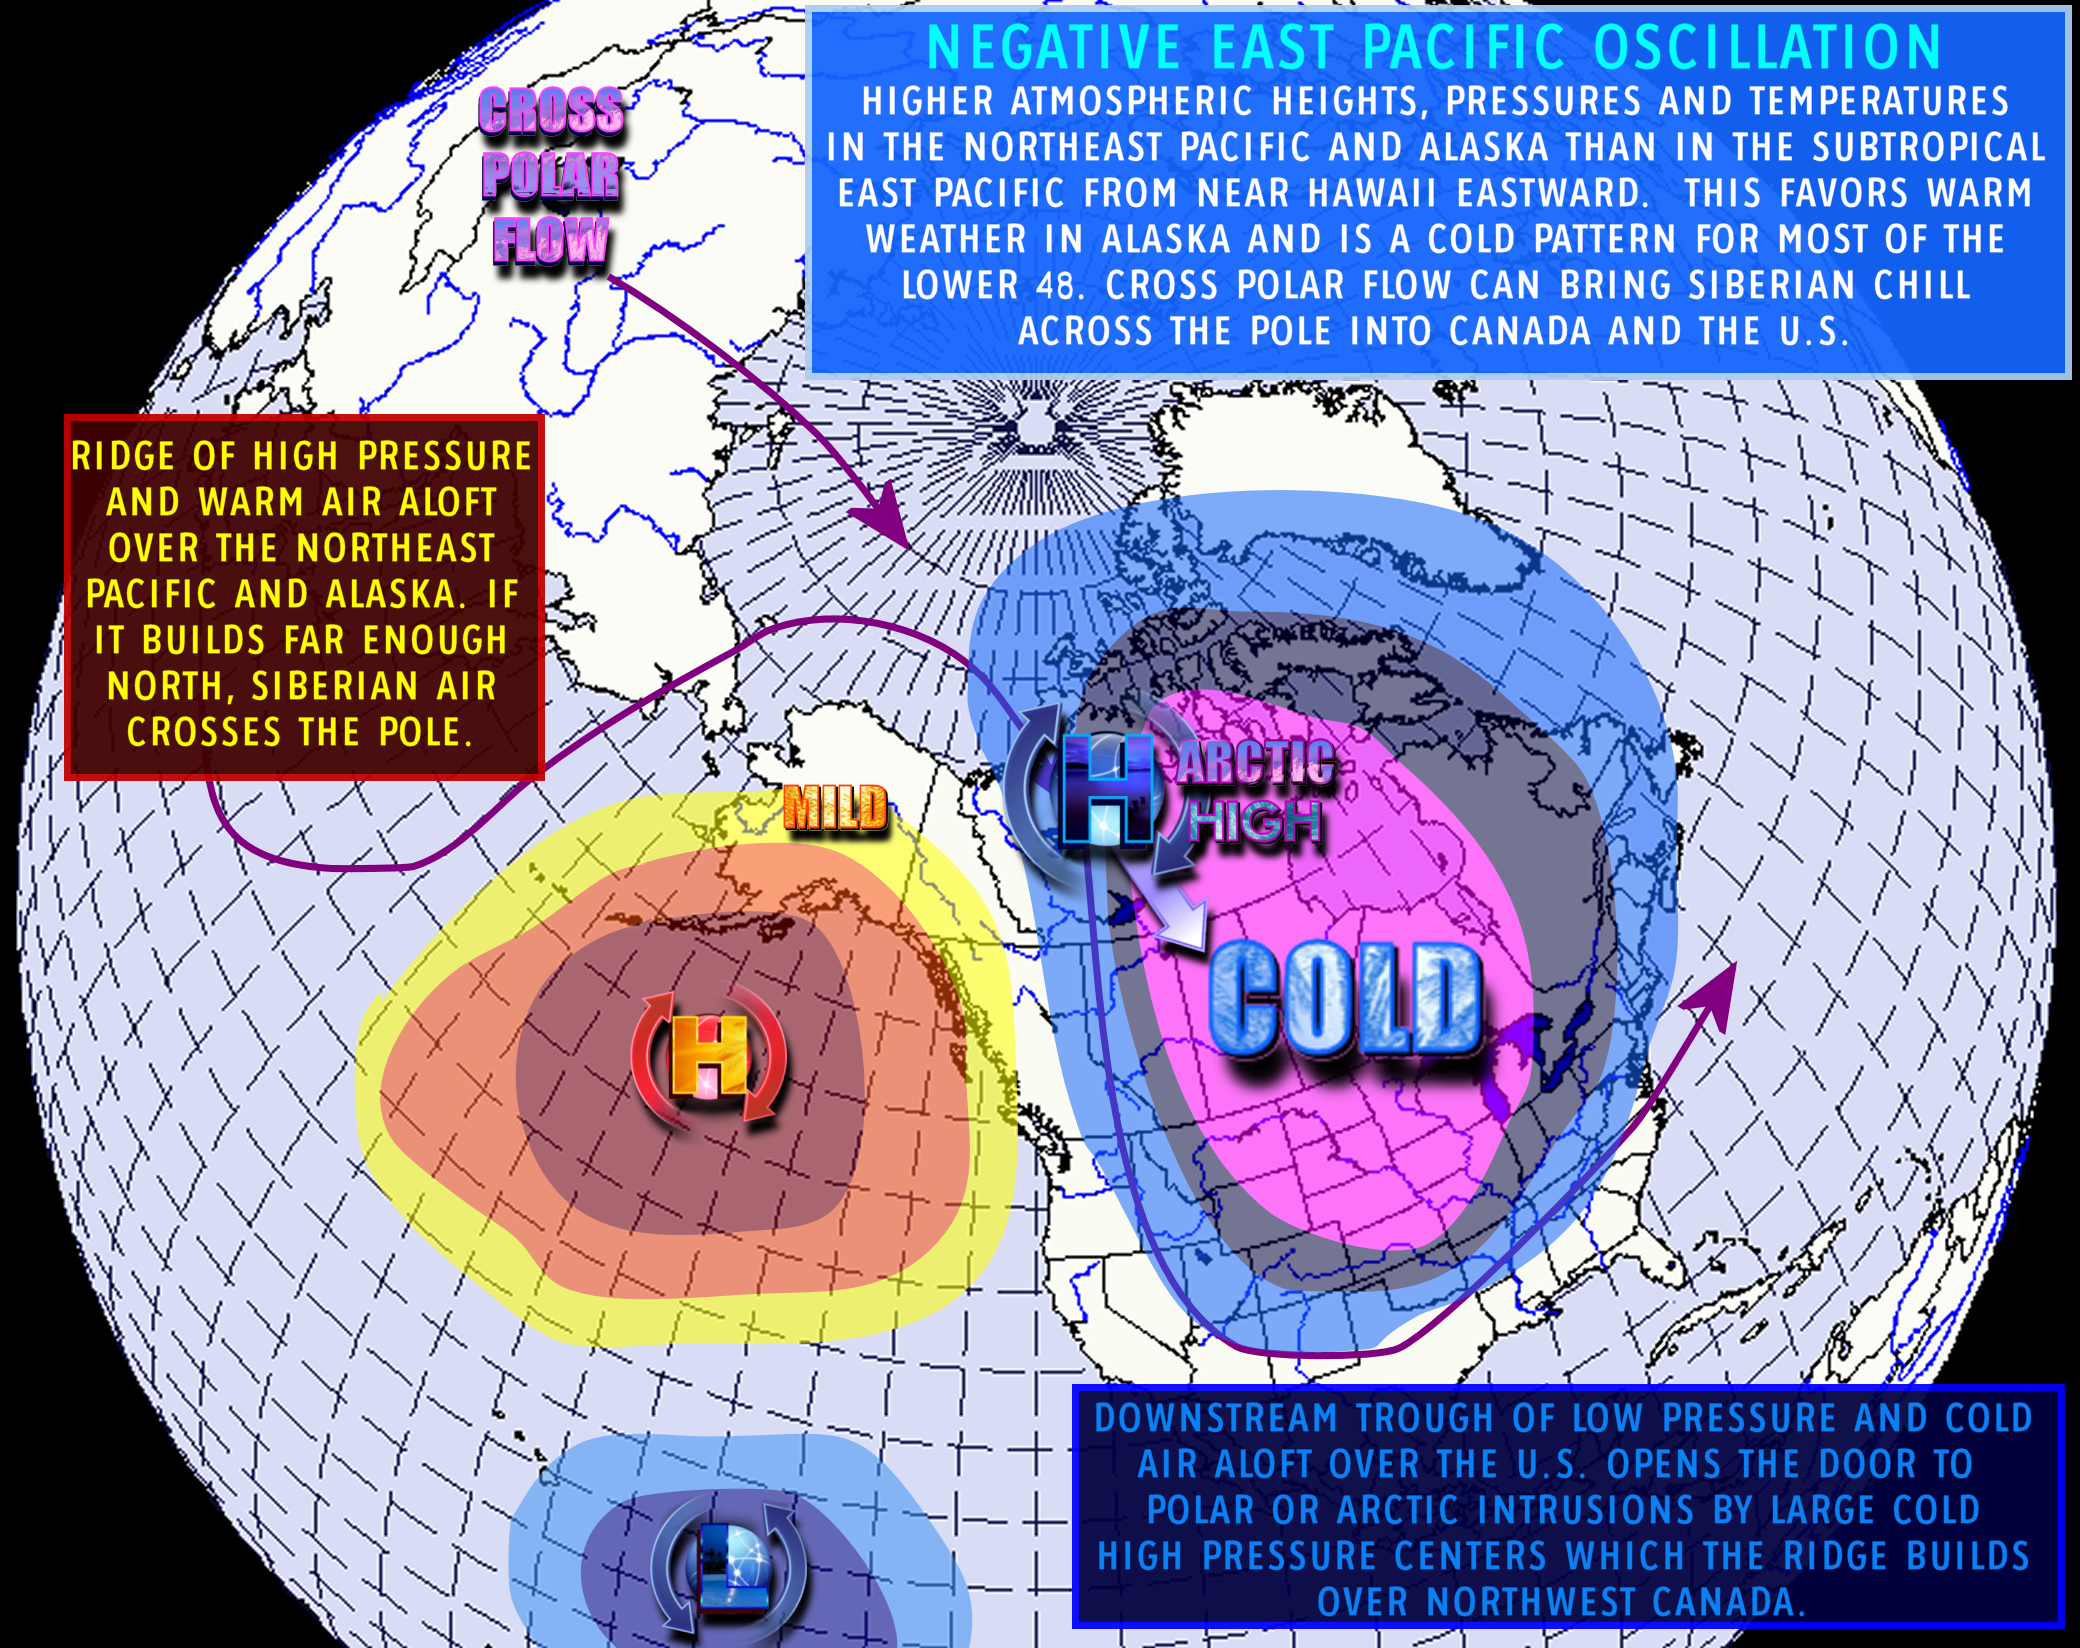
6. EPO (Eastern Pacific Oscillation)
The Eastern Pacific Oscillation (EPO) is the upper wind flow over the Eastern Pacific influenced by the ocean. When in a positive phase, the EPO funnels milder, Pacific air well inland into the country and limits arctic outbreaks by holding them up in Canada. When the EPO is dominated by a negative phase, more ridging develops along the West Coast as higher pressure extends from the Gulf of Alaska south along the West Coast of Canada. This forces a northwesterly flow from Canada into the middle and eastern sections of the US and thus, the delivery of polar or arctic air. It appears that the EPO is as much (and sometimes more) of a determining factor to the overall temperature trend of the winter than the NAO. In some El Niño winters, it was noted that if the winter was dominated by a negative EPO, even when accompanied by a predominantly neutral to positive NAO, temperatures over the area were generally below normal while snowfall was above. The coldest periods of any of the winters take place when both the EPO and NAO are in a negative phase. Based on sea surface temperatures his season, I expect a negative EPO to form.

Above: the Negative Phase of the EPO (Source: https://kcstormfront.files.wordpress.com/2013/12/epo3.png)
Conclusion: Helps usher in colder air
Recap
1. El Nino is near record territory, but it is forecast to weaken to a moderate stage. If El Nino does not weaken as expected, there could be an influx of warmer air from the Pacific. This could lead to less snowfall.
2. Although it’s hard to forecast these factors more than a few weeks in advance, Pacific and Atlantic Sea Surface Temperature anomalies point towards the building of a -AO/-NAO/-EPO. If the NAO does not go negative, this may cause problems for our winter pattern especially in the later months when things should be more favorable for snow.
3. Siberian snow cover has picked up and computer models show this continuing into the first half of December. This will help enhance the chances of getting a -AO this winter.
4. The first month or so of winter will feature above-normal temperatures and more rain than snow. As the pattern shifts, we’ll enter a colder pattern with increased snow threats after Christmas. The brunt of winter may not come until late January/early February. But if December is much colder and snowier than expected, we could see a lot more snow than anticipated.
The Daily Pennsylvanian is an independent, student-run newspaper. Please consider making a donation to support the coverage that shapes the University. Your generosity ensures a future of strong journalism at Penn.
DonatePlease note All comments are eligible for publication in The Daily Pennsylvanian.