When Peter Jones, a Penn Medicine professor of pathology and laboratory medicine, wandered into a Penn Design conference and met architect Jenny Sabin, it only took 10 minutes to reshape his philosophy on the intersections between art and science.
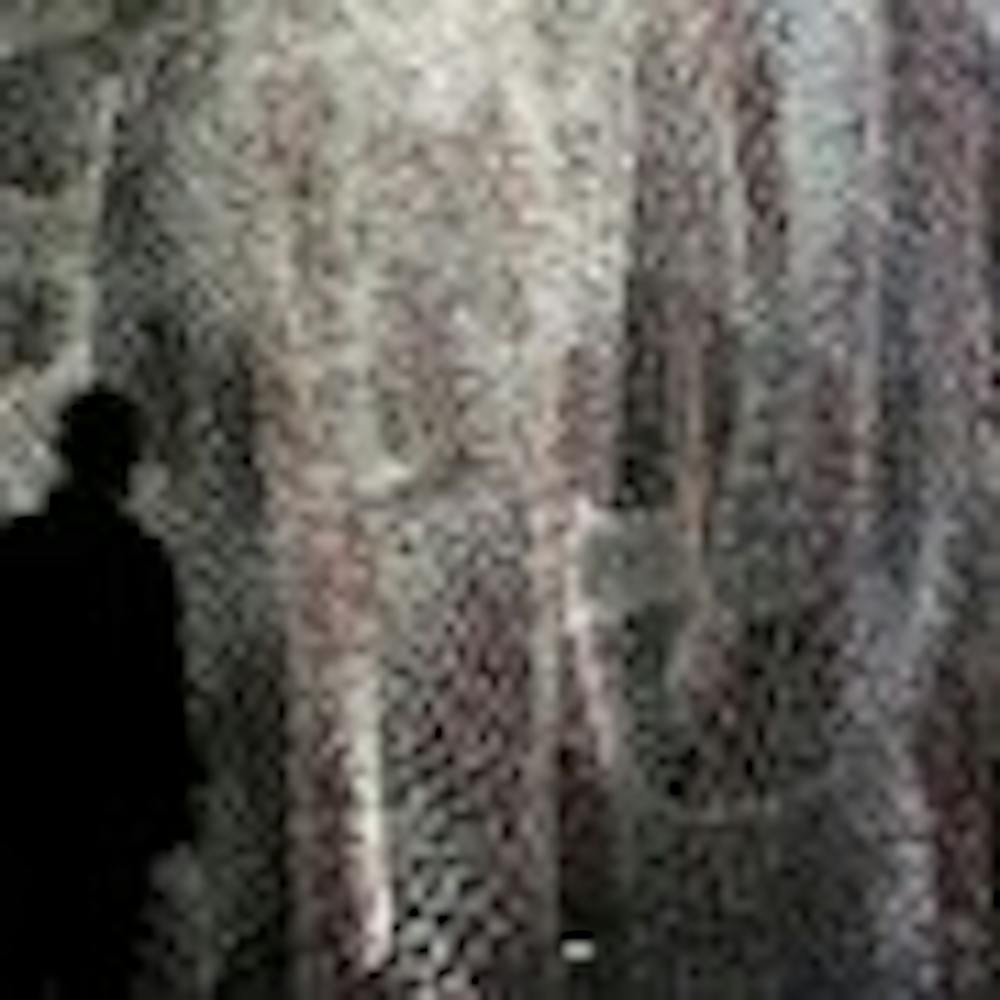
Four years and 75,000 zip ties later, the art installation “Branching Morphogenesis” was born.
The exhibit, currently housed in a digital art museum in Austria, is a model of the process of blood vessel formation in early lung development. Each zip tie symbolizes a data point in a four-dimensional “datascape” that is 12 feet high, 15 feet wide and eight feet in depth, and includes four layers that show the progression of the process through time.
The exhibit was created through the group Sabin+Jones LabStudio at Penn, a design and biology collaboration Sabin and Jones started after their initial meeting.
By using zip ties to represent biological processes, the exhibit “takes something that could be foreign to most people on a biological level and puts it into a realm that people can identify with,” said designer Andrew Lucia, an associate researcher at the Sabin+Jones LabStudio who worked on the project.
“People are drawn by the complexity of it, and when they realize that it’s built out of zip ties, it’s a ‘what the hell, why would anybody do that’ kind of moment,” Lucia said.
According to Jones, the project stemmed from an interest in how cells interact with their environment.
“Essentially, we’re trying to visualize features within a system that can’t be seen,” Jones said. “It’s not representative directly of the lung, but instead the movement of forces through time as lung cells form a capillary network,” he said. The installation is a visual representation of a computational simulation outlining different paths in the process.
Lucia said the exhibit is a way in which people can interact with data, adding that museum directors “were afraid kids were going to start climbing on it.”
“I don’t think it could withstand that,” he said with a laugh.
Earlier this month, the installation won the 2009 International Science and Engineering Visualization Challenge award in the “illustration” category, sponsored by the National Science Foundation and the American Association for the Advancement of Science.
“A big mission of theirs is to promote imagery that answers larger questions about how to reach broader audiences,” Sabin said. “It was the fact that our image had dimension to it, so that people could walk through a data set.”
“Why don’t more of these bridges exist between fine arts and sciences?” Jones asked. “Until the recent culture of specialization, they did. But we’ve found tremendous value in bringing these subjects together.”
Jones hopes the installation will not only allow museum visitors to interact with data in new ways, but also to “inspire kids to get interested in science.”
“That’s equally thrilling,” he said.
Sabin said the combination of artistic and scientific recognition “really rewards our work.”
“It shows that we formulated a collaboration that is truly trans-disciplinary,” she said.


